Introduction
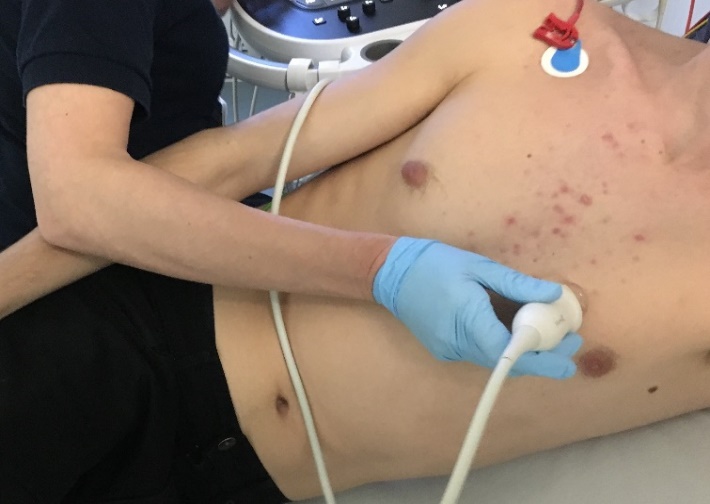
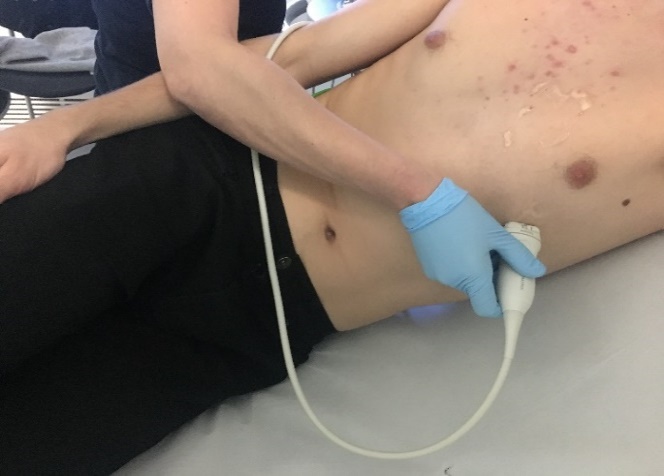
Echocardiography is a routine diagnostic test, used in the management and follow-up of patients with known or suspected heart disease. Transthoracic echocardiography (TTE) uses ultrasound waves to see moving images of heart structures. An ultrasound probe is placed at various points on the chest to visualise the heart.
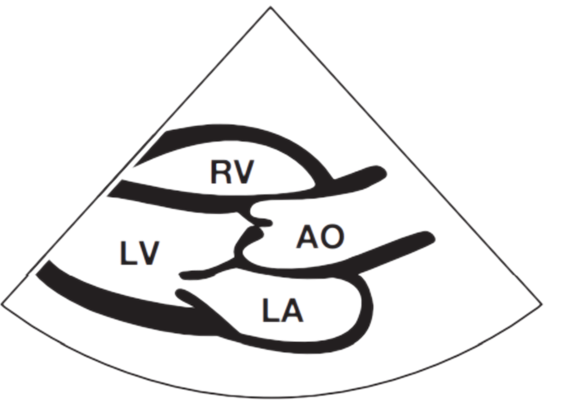
Parasternal Long Axis View
Apical 4 Chamber View
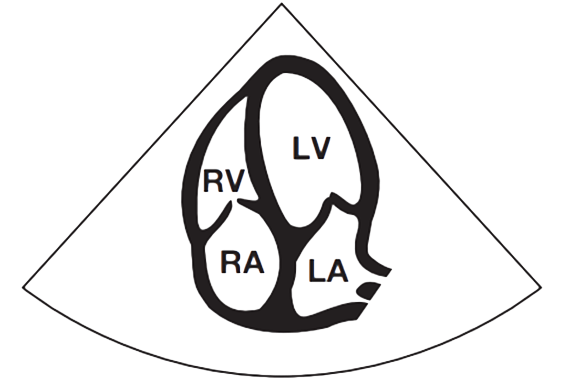
Commonly, the size and function (or pumping action) of the four cardiac chambers can be evaluated. The four chambers of the heart are the left ventricle (LV), right ventricle (RV), left atrium (LA) and right atrium (RA). Indeed, the majority of echocardiographic studies are performed to investigate LV chamber dimensions and function. The four cardiac valves can also be assessed: the aortic valve (AV), mitral valve (MV), tricuspid valve and pulmonary valve.
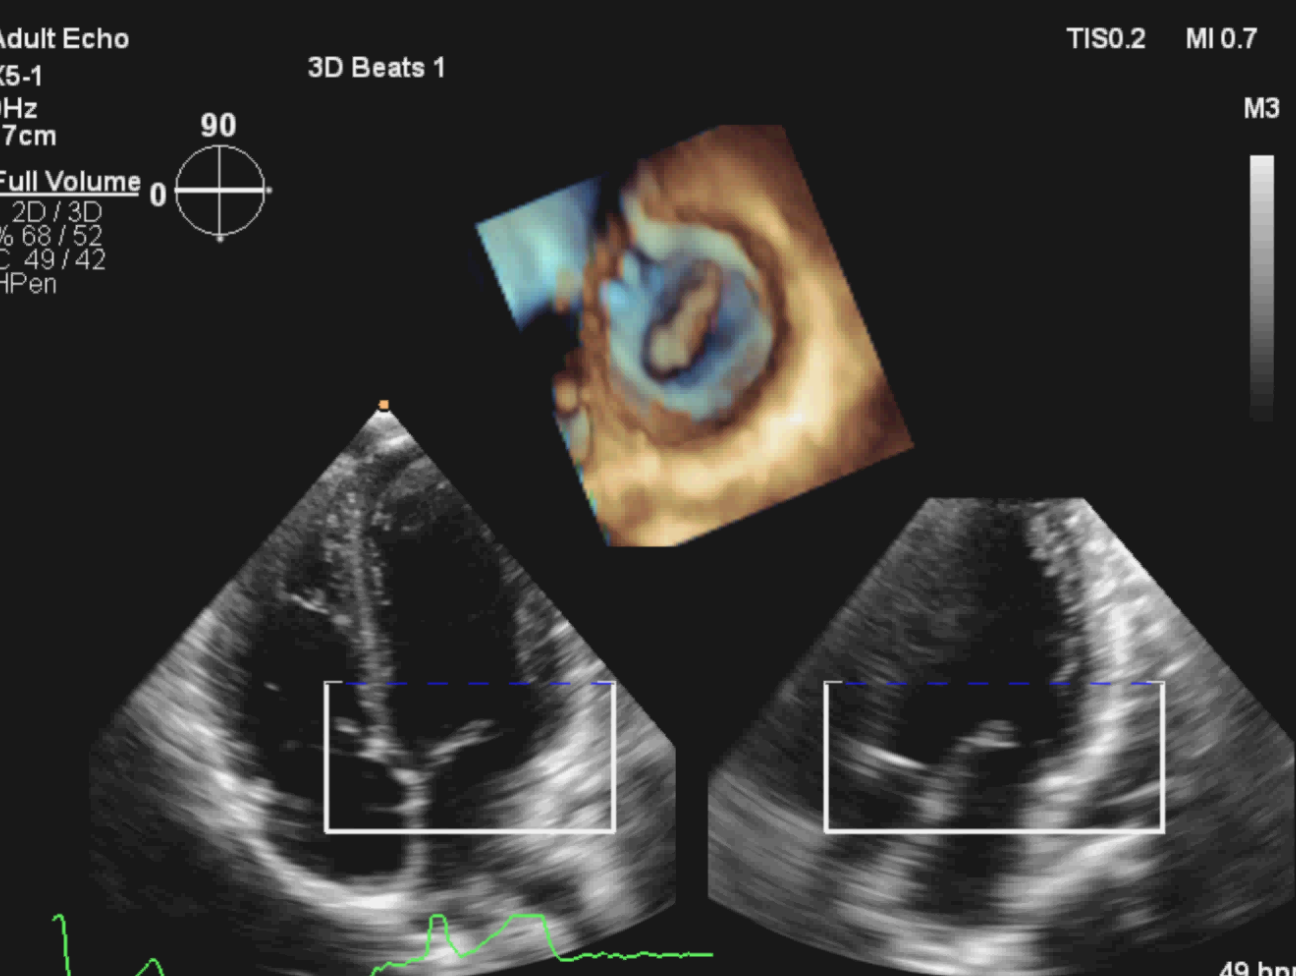
TTE uses both 2-dimensional imaging (2D) and 3-dimensional (3D) techniques to image the heart structures. 2D imaging of the heart has been the mainstay of echocardiography since the 1970’s. Indeed, the majority of clinical echocardiography workflow within UK cardiology departments is currently based on 2D imaging.
The first 3D echocardiogram was performed in 1992 and was primarily restricted to a research role, mainly due to the developmental nature of 3D in terms of both quality of images and time to process those images. However, over the last 10 years, 3D echocardiography technology has developed substantially in terms of software and hardware. Using complex ultrasound probes and processing software, real-time 3D echocardiography can add valuable clinical information to the established technique of 2D imaging. Despite this impressive advance in 3D imaging, adoption of the technique into the everyday clinical environment has been limited. 3D imaging is however, slowly infiltrating into specialist areas within the cardiology service such as paediatric cardiac assessment and intra-operative procedures; for example, transcatheter aortic valve implantation (TAVI).
3D Echocardiography
The introduction of matrix-array[1] transducers into clinical practice has been key to the rapid development and progression of 3D echo techniques. Using such a probe, the operator is capable of acquiring full volumetric datasets from one single picture. There are several advantages to 3D echocardiography:
-
Cardiac structures are shown in all three spatial dimensions, allowing for a full understanding of the relationship between them.
-
3D echo offers freedom of analysis, as datasets can be rotated, manipulated and viewed from different perspectives.
-
Communication of diagnostic data becomes more effective, as 3D images are more intuitive and easier to understand by non-specialists.
Currently, the calculation and evaluation of volumes and geometry by 2D echo is strongly operator dependent. The echocardiographer manipulates the probe in order to improve images, therefore, whenever pathology is present, findings may be missed or misinterpreted. Through direct volume measurements on 3D echo, quantification becomes more detailed, accurate and reliable. The images acquired are unique and aid to the diagnosis of complex cardiac disease. Heart valves are visually reconstructed and their dynamic motion demonstrated.
Nowadays, real-time 3D echocardiography is available on most echo machines.
There are, however, some disadvantages when using 3D imaging. For example, akin to 2D imaging, 3D imaging is prone to artefacts. One of these artefacts is known as “stitching”, where the resulting 3D image appears to be composed of multiple images, making interpretation difficult. This is caused by lung motion inside the chest during breathing. To prevent this, patients are asked to temporarily hold their breath for a few seconds each time a dataset is acquired.
There are two main modalities that can be used to display 3D images: volume and surface rendering. In volume rendering, different colour maps are used to convey a perception of depth. In surface rendering, the 3D surface of cardiac structures identified by manual tracing or, most commonly, via automated border detection.
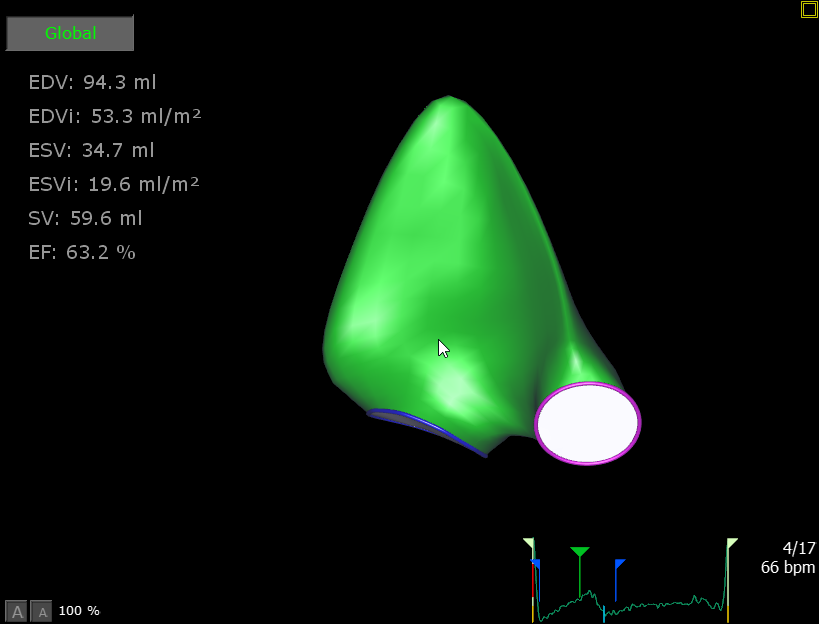
3D and the LV
The left ventricle pumps oxygenated blood through the aorta, into the systemic circulation. This blood carries oxygen to the muscles and brain. Therefore, the assessment of LV function using echocardiography plays a critical role in the diagnosis and treatment of patients with suspected or known cardiac disease. However, as only one plane can be visualized at a given time on 2D echocardiography, studies tend to rely upon geometric assumptions, meaning their accuracy and reproducibility are suboptimal. 3D imaging overcomes this, offering a precise and reproducible quantitative assessment. The geometry of the LV can be reconstructed at the point of acquiring the images while the patient is with us, or alternatively, after the patient has left the echocardiography lab. Function, performance and volumes can then be analysed offline on dedicated workstations.
Further technology for the assessment of LV function using 3D imaging has been developed, 3D strain imaging:
-
This software analyses the mechanics of the LV, in the relaxation and pumping phase (the pumping function of the heart is called ‘systolic function’)
-
The LV is composed of varying muscle fibres, all with a different placement and orientation, allowing it to squeeze inwards and downwards, stretch outwards and upwards, and twist along its length
-
3D strain follows the motion of small ultrasound dots reflected by the whole muscle. This demonstrates how the heart moves. Normally, the heart contracts and relaxes as one entity, however, regions of reduced movement may be identified, for example where scar tissue is present
-
Scar tissue affects the movement of specific areas of muscle. This is called dysynchrony. Dysynchrony is one of the many mechanisms involved in heart failure
3D and the RV
The right ventricle sits in front of the LV inside the chest and pumps deoxygenated blood from the body into the lungs. It has a crescent shape and appears to embrace the LV. The RV has three different regions; the inflow, the outflow and the apex (tip), none of which can be seen simultaneously in the same picture on 2D imaging. The pattern of RV contraction differs from that of LV contraction, as muscle fibre geometry is not the same.
Any pathologic conditions that severely affect the lungs, such as pulmonary hypertension or blood clots, might lead to impaired RV contraction. RV impairment leads to a reduction in blood flow to the lungs, resulting in less oxygenated blood reaching the LV. This is called right-sided heart failure. Right-sided heart failure may also occur with significant congenital pathology (heart defects from birth). Modern echocardiographic technology allows the detection of cardiac congenital abnormalities in the neonatal phase or even whilst the baby is still in the womb.
As previously mentioned, 2D echocardiography relies on geometric assumptions, this holds true for the assessment of RV function and size. The gold standard for assessment of the RV has historically been magnetic resonance imaging (MRI)[2]. MRI is more expensive, lengthy and uncomfortable for the patient. The advent of 3D echo has changed this. RV assessment using 3D correlates well with MRI findings. 3D has the advantage of being non-invasive, faster and able to be used in an outpatient clinic setting.
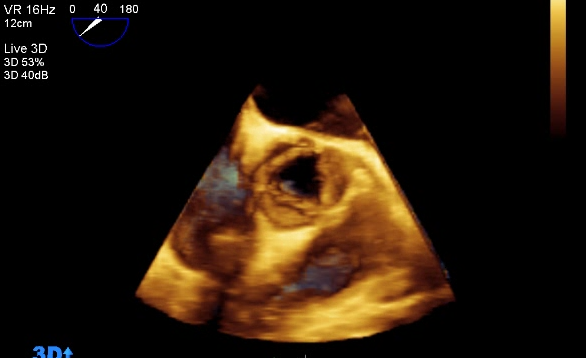
3D evaluation of heart valves
Mitral Valve
When careful assessment of the mitral valve is vital, for example, before and after replacement or repair of the valve, 3D echocardiography offers significant advantages over 2D imaging. 3D imaging provides a surgical ‘en-face’ view of the valve, this compares well with surgeon’s own view intra-operatively. As 3D echocardiography is free from geometric assumptions, there is increased accuracy in pathologic diagnosis and assessment of the mitral annular geometry, both of which are critical for surgical planning. Examples of mitral valve pathology include the identification of prolapsing leaflets, chordal rupture, perforations and flail segments. These pathologies can cause blood to leak backwards through the valve, into the left atrium. This leak is called mitral regurgitation; 3D echocardiography allows accurate visualization of the degree of
regurgitation. We can then make a comparison of the regurgitation before, during and after the procedure. This comparison helps in the assessment of procedural success.
Therefore, 3D echocardiography aids mitral valve interventional and surgical procedures by:
-
Accurately reconstructing morphology of the valve
-
Planning the intervention or procedure
-
Intra-operative assessment
-
Success of intervention or surgery
Aortic valve
Aortic stenosis[3] (AS) is a common valvular disorder in the elderly, with a prevalence of 8% at age 85. Patients with severe symptomatic AS have a poor prognosis. Many patients are considered high risk and denied valve surgery, due to advanced age and multiple comorbidities[4].
TAVI is a relatively new technique, transforming the treatment of patients with AS. The TAVI valve is constructed using animal cardiac tissue (usually bovine) and mounted on an expandable stent. The first successful implantation occurred in April 2002.
The procedure is performed under general or local anaesthetic and is far less invasive than open-heart surgery. A catheter is inserted into an artery and advanced into the heart. A balloon is then inflated inside the diseased valve, in order to make room for the new TAVI valve. Depending on the type of TAVI, it may expand by itself or it may require another balloon to expand it. Once the valve has been deployed, the catheter is removed and the point of access sealed. Currently, the three most common approaches are the trans-femoral (via an artery in the groin), trans-apical (via a small puncture at the tip of the heart) and trans-axillary (via an artery in the shoulder area).
In Oxford, there has been a three-fold increase in referrals for TAVI procedures over the last three years, along with a four-fold increase in procedures within the same timeframe. The process has been streamlined and currently, the team at the Oxford Heart Centre performs up to four cases a day, a total of over 200 cases per year. Each case can take around 45 minutes to complete and most are performed under local anaesthesia.
Two key aspects of a successful TAVI implant are the pre-procedural assessment of the diseased valve and the intra-operative evaluation of the new TAVI valve. Echocardiography plays a central role in guiding:
-
Patient selection
-
Choice of procedural access
-
TAVI size and type
-
Procedural guidance and detection of early and late complications
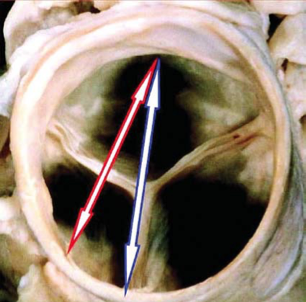
TAVI valves are manufactured in a range of different sizes, therefore, echocardiography is needed to study the anatomical structure of the stenosed valve and to measure the dimension of the valve annulus[5]. An accurate measurement of the valve annulus avoids future sizing problems; under-sizing can lead to significant leaks, whilst over-sizing may lead to procedural difficulties.
This is where 3D shows its value. Whilst 2D shows us the separation point between two of the three leaflets clearly (red arrow in the illustration below), this is a much shorter diameter than the real anatomic diameter visualised by 3D. In this case, if the TAVI operators had been guided by 2D echo alone, the TAVI valve used could potentially be too small.
During the procedure, 3D can be a valuable tool when positioning the TAVI valve. Immediately post valve deployment, TAVI valve position and function can be quickly and accurately assessed by 3D echocardiography.
Other 3D modalities are currently being used in TAVI procedures. Researchers at Georgia Institute of Technology and the Piedmont Heart Institute are using multi-material 3D printers to create valve models, tailored to the individual patient. These models simulate both the tissue characteristics and the physiological behaviour of a real valve. These valve models are generated using standard imaging techniques, such as echocardiography. The aim of this technique is “to improve the success rate of TAVI by picking the right [valve size and type] and avoiding paravalvular leakage”.
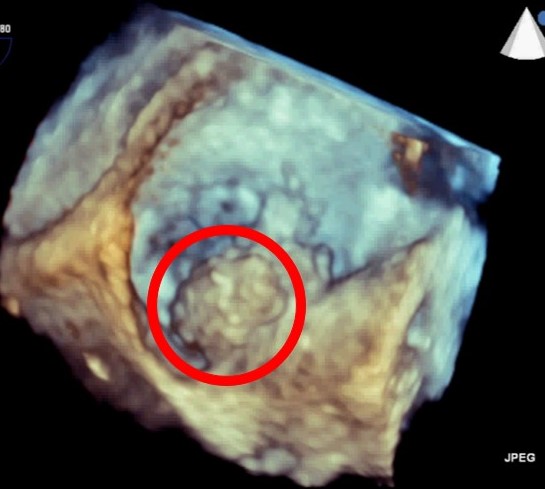
Masses
Cardiac masses are structures usually found unexpectedly inside the heart. Cardiac masses are relatively rare. Even though masses are usually an incidental finding, they can cause significant physiological and subsequent symptomatic difficulties for patients. Masses can obstruct valves, cause arrhythmias[6] or may even dislodge and travel with blood flow to remote organs such as the brain, arms and legs.
Therefore, it is vital to establish the physical implication of a mass on cardiac function and to define whether they are benign or malignant in nature. Masses can also present as ‘vegetations’. Vegetations are usually attached to the heart valves and are caused by a bacterial infection called endocarditis.
Given the sense of urgency in the assessment of these structures, echocardiography becomes the imaging technique of choice, being widely available and providing almost immediate results. 3D imaging offers clear advantages, as it not only allows the operator to understand the mobility and attachment of the mass, but also provides improved information about its volumetric dimensions and composition.
Atrial Septal Defect
An atrial septal defect (ASD) is a hole in the wall between the two upper chambers of the heart (atria). This condition tends to be congenital. Small defects may never cause a problem and may close on their own during infancy or early childhood. Large and long-standing atrial septal defects can damage the heart and lungs. Surgery may be necessary to repair atrial septal defects to prevent complications
Left Atrial Appendage Closure
Atrial fibrillation (AF) is the most common, abnormal cardiac arrhythmia seen in clinical practice. Patients with AF may not experience symptoms relating to their arrhythmia. However, symptoms of dizziness, shortness of breath and/or palpitations may be present.
In AF, irregular contractions of the left atrium can result in less effective blood transfer into the ventricle. Blood pooling can occur within the atrium and lead to blood clots (thrombus). The left atrial appendage (LAA) is a small sac in the muscle wall of the left atrium. The LAA is the site at which over 90% of these clots will occur. Should a clot become dislodged from the heart; it can travel to the brain. This clot may cause a blockage in brain circulation and lead to a debilitating or fatal stroke.
Left atrial appendage closure is a procedure to seal off your LAA and reduce the risk of stroke. There are various LAA devices commercially available. Below is an example of the ‘Watchman device’.
Conclusion
The rapid development in 3D imaging software and hardware has realised new opportunities for its application in the cardiac clinical setting. 3D imaging offers specific advantages over 2D imaging in the objective measurement and functional assessment of cardiac chambers and valves. Currently, 3D cardiac imaging has an important and increasing role in valve assessment for surgery and invasive heart procedures such as TAVI implantation.
Despite these positive applications, the adoption of this modality is largely limited to tertiary or specialist hospitals, where the majority of cardiac surgery and complex valve procedures are performed. However, 3D imaging would add significant diagnostic value in a district hospital setting where the majority of echo studies for LV volumetric and functional assessment are performed. Ideally, future adoption of 3D imaging for routine assessment, alongside 2D imaging, in the district hospital setting should become part of the routine cardiac clinical care landscape. Further education in the practice and clinical use of 3D imaging will increase confidence, expertise and routine adoption of this technique.
Automatic techniques to use 3D imaging data are currently available and hold future promise for speed and ease of use, which in turn, will improve the care of our patients.
However, further study is needed on workflow and cost implications.
Finally, 2D and 3D imaging are based on a manual technique, therefore the resultant images will depend on the operator. To produce excellent diagnostic-quality images, we have to highlight and applaud the specific skillset demonstrated by the experienced echocardiographer: excellent knowledge of anatomy, physiology, spatial awareness, a developed technique and a degree of creativity.
Acknowledgements:
Dr Jim Newton and Professor Paul Leeson for their advice and kind permission to reproduce their excellent images.
Cameron Dockerill for his invaluable help with video and image preparation.
Daan Javornik at TomTec for allowing use of supplementary images.
References
-
Cameli M, Mondillo S, Solari M et al. Echocardiographic assessment of left ventricular systolic function: from ejection fraction to torsion. Heart Fail Rev 2016;21:77–94.
-
Pandian NG, Nanda NC, Schwartz SL, et al. Three-dimensional and four-dimensional transesophageal echocardiographic imaging of the heart and aorta in humans using a computed tomographic imaging probe. Echocardiography. Nov 1992;9(6):677-687.
-
Cheng K, Monaghan MJ, Kenny A, et al. 3D echocardiography: benefits and steps to wider implementation. BJC. 2018;25:63-8.
-
Badano LP. The Clinical Benefits of Adding a Third Dimension to Assess the Left Ventricle with Echocardiography. Scientifica 2014;2014:1–18.
-
3D model could be used to predict paravalvular leak after TAVI - CN. Cardiovascular News2018.
-
Badano LP. The Clinical Benefits of Adding a Third Dimension to Assess the Left Ventricle with Echocardiography. Scientifica 2014;2014:1–18.
-
Bleakley C, Eskandari M, Monaghan M. 3D transoesophageal echocardiography in the TAVI sizing arena: should we do it and how do we do it? Echo Research and Practice 2017;4, DOI: 10.1530/erp-16-0041.
-
Dutta T, Aronow WS. Echocardiographic evaluation of the right ventricle: Clinical implications. Clinical Cardiology 2017;40:542–8.
-
Fernández-Golfín C, Zamorano JL. Three-Dimensional Echocardiography and Right Ventricular Function. Circulation: Cardiovascular Imaging 2017;10, DOI: 10.1161/circimaging.117.006099.
-
Lang RM, Badano LP, Tsang W et al.EAE/ASE Recommendations for Image Acquisition and Display Using Three-Dimensional Echocardiography. European Heart Journal - Cardiovascular Imaging 2012;13:1–46.
-
Mankad R, Herrmann J. Cardiac tumors: echo assessment. Echo Research and Practice 2016;3, DOI: 10.1530/erp-16-0035.
-
Ostenfeld E, Flachskampf FA. Assessment of right ventricular volumes and ejection fraction by echocardiography: from geometric approximations to realistic shapes. Echo Research and Practice 2015;2, DOI: 10.1530/erp-14-0077.
-
Simpson J, Lopez L, Acar P et al.Three-dimensional Echocardiography in Congenital Heart Disease: An Expert Consensus Document from the European Association of Cardiovascular Imaging and the American Society of Echocardiography. Journal of the American Society of Echocardiography 2017;30:1–27.
-
Sugimoto T, Dulgheru R, Marchetta S et al.What Does 3D Echocardiography Add to 2D Echocardiography in the Assessment of Mitral Regurgitation? Current Cardiology Reports 2017;19, DOI: 10.1007/s11886-017-0901-7.
-
TAVI. – how do pacemakers work – how are they fitted – British Heart Foundation.
-
The Development of Transcatheter Aortic Valve Implantation (TAVI). DAIC 2018.
-
Unique 3D-printed heart valves could reduce TAVI paravalvular leakage rates. Cardiovascular News 2017.
-
Vincelj J, Jurinjak SJ, Udovicic M et al.Three-dimensional echocardiographic diagnosis of intracardiac masses. Cardiologia Croatica 2015;10:93–4.
-
Zamorano J, Pardo A. 3D-ECHO for TAVI: two arrows, just in case. European Heart Journal – Cardiovascular Imaging 2015, DOI: 10.1093/ehjci/jev282.
-
Zamorano JL, Badano LP, Bruce C et al.EAE/ASE Recommendations for the Use of Echocardiography in New Transcatheter Interventions for Valvular Heart Disease. Journal of the American Society of Echocardiography 2011;24:937–65.
-
Zamorano J-L, Saltijeral A, de Isla LP. Transesophageal 3D echo for heart valve evaluation. European Society of Cardiology 2010. An article from the e-journal of the ESC council for Cardiology Practice. Volume 8, № 25.
-
Atrial fibrillation: the management of atrial fibrillation (CG180). NICE guidance, June 2014. Paragraph number 1.5.20, 18.
-
FATE (Focus Assessed Transthoracic Echocardiography) echo protocol

Glossary of terms
1. Matrix array transducer
3000 crystals arranged in rows and columns within the transducer
2. MRI
Magnetic Resonance Imaging, a large magnet using radio waves and complex software to create a detailed, cross-sectional image of internal organs and structures
3. Aortic Stenosis
Narrowing of the aortic valve opening restricting the blood flow from the left ventricle into the aorta
4. Comorbidities
One or more additional disease/disorder co-existing with a primary disease/disorder
5. Annulus
For example, the mitral annulus is the anatomical junction between the left ventricle and left atrium. The annulus serves as an insertion point for the valve leaflets
6. Arrhythmia
A general term for any abnormal heart rhythm, whether it be irregular, too fast or too slow
Video credits: © Jim Newton and the John Radcliffe Hospital ; masses credit © Prof Paul Leeson and the John Radcliffe Hospital